Lack of Diversity in American Crime? Part I of II.
Some data-informed reflections inspired by the recent lootings in Philadelphia, Chicago, and elsewhere.
Your author is native born to Benjamin Franklin’s adopted city and our nation’s first capital, Philadelphia. So, too, is “Meatball” — the social media nom de plume of a young black woman and live-streamer whose work was recently featured by the Daily Caller as she documented the destructive looting which took place in downtown Philly on September 26, 2023.
In the Daily Caller YouTube comment section, one finds the remarks one might expect. A majority of which merit no further consideration. But the claim that crime in America lacks racial diversity is not trivial, even if many would wish to pre-emptively denounce it as racist.
First, this claim can be proved true or false. Either outcome has consequences which matter significantly. Second, this claim in various forms has been made recently by prominent black public intellectuals. To cite two, Glenn Loury, Merton P. Stoltz Professor of the Social Sciences and Professor of Economics at Brown University, and John McWhorter, Associate Professor of Linguistics at Columbia University, recently (Sept 11, 2023) had a sobering and even sad discussion about “Mob Behavior” in Chicago — discussing among other concerns the looting and property destruction.
A black thing?
In this exchange, McWhorter (Sept 11, 2023) specifically claimed:
There’s a sense I have that these things are done almost exclusively by young black men and not even Latino young men as much as black young men. You do not see a bunch of poor Asian kids doing it — you do not see even lower-class white kids doing it. It’s a black thing to join up in a gang like that and to tear everything up for no particular reason.
Loury in turn generally agreed, and both men discussed possible root causes. McWhorter’s remarks hit home with the Philadelphia incident: recall the young black people smashing the iPhones which they could not simply steal and then activate. That iPhones have such theft protection is common knowledge. To “tear everything up for no particular reason” except perhaps the act of destruction itself?
For the sake of argument, based upon all the video evidence thus far, your author will concur in general terms with Professor McWhorter: the recent shoplifting and looting rampages in major American cities have been dominated by young black men and women. Not exclusively so, by any means, but majority so.
Forget Videos — What About the Data?
But what about crime in general? Both the FBI and the Census Department identify different racial groups within the USA. American Exile will use ONLY the government categories and data. Based on USA government data, do we have racial differences when it comes to crime?
A Simplified and Hypothetical Example – About the Math
Before we dive into what our government counts as racial groups — and racial in distinction to ethnic groups, we will consider a simplified example of crime arrest counts per group, crime arrest percentages per group, and crime arrest percentages per group as a ratio to that group’s population percentage. For the non-math people, this sounds harder than it is.
Please consider the first graph which lists the raw number of arrests per group per year. We have a hypothetical population of 200 million people, 60% of whom belong to Group A — Orange; 30% to Group B — Yellow; and 10% to Group C — Green. The numbers below on the Y axis represent 100K. For our first year of data, we have 1.2 million Orange arrests; 0.6 million Yellow arrests; and 0.2 million Green arrests.
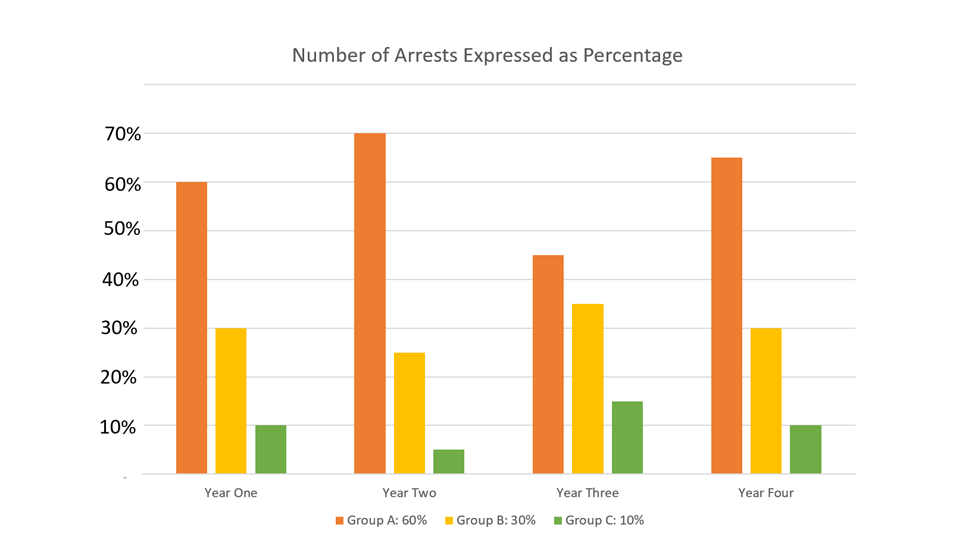
Notice that we can take these raw count numbers per year and express them as percentages of the total arrests per year. This makes the comparison between groups more intuitive — easier. So below is the same graph, but with a percentage rather than raw count.
We see that for our first year of data, Orange has accounted for 60% of all arrests; Yellow, 30% of all arrests; and Green, 10% of all the arrests. In fact, if we average the arrest percentages over all four years of data, we get roughly the same percentages. Yes, indeed, the Orange population accounts for more arrests — but the Orange population is also considerably larger, at 120 million people; Yellow, at 60 million; and Green, at 20 million. So we might reasonably expect this outcome — more Orange people, so more Orange arrests.
To have a more valid comparison, we can scale the arrest percentage against the population percentage: a simple ratio. When we do, we get the following graph:
If we were to average all four data years on the above, we would reach the following conclusion: based on the data we do have, we have no reason to believe any of our population groups differ in terms of their arrest rate or criminal activity.
For example, based again upon the data and what it shows, if the Orange population were to shrink to 10% of society, and the Green population grow to 60% of society, we would reasonably forecast the Orange arrest rate to shrink proportionally and the Green arrest rate to grow proportionally. We earlier found no meaningful difference between groups in terms of their arrest rate or criminal activity.
Sadly, as it will turn out, this is NOT the case for the FBI Crime data on American society.
When examining the FBI Crime, we will consider the arrest percentages per group (just another version of the arrest raw count per group) and the arrest percentages per group scaled to the population percentage per group. So we will be looking at the equivalent of graphs two and three above.
The FBI Race Categories, and US Census Race Count
As stated earlier, for this post, American Exile will use ONLY the government categories and data. We provide direct links to the original sources. In addition, as is our standard practice, we provide a Github repo with the code used to produce the visualization and the data sets used. Again, as always, any data analysis done by Data Humanist for American Exile offers complete transparency and reproducibility.
That said, how the USA government defines race for the FBI data and the Census population is likely NOT what you have been led to believe. Take this up with the MSM, with nearly all of academia, with Democratic party pundits, and with the USA government, if you like — American Exile is NOT responsible for the following racial categories.
Data Sources
Our primary data source for crime is the FBI Uniform Crime Report (UCR), 1995-2019. The format of the FBI UCR changed significantly in 2020, after 24 years of remarkable consistency. So our supplement source is the FBI Crime Data Explorer, which makes data for the years 2020 and 2021 downloadable. The years 1995-2019 can be treated as one large data set; the years 2020-2021 get treated as a separate data set, although the main categories and classifications are generally equivalent.
Our primary data source for USA population demographics, using USA census data and matching the FBI categories for race, is USAFacts.org: Our Changing Population. Crime data from the FBI; population data from the Census Bureau via USAFacts.org.
Race Categories according to the FBI
We now come to wrestle with the race category bear.
From 1995 to 2012, and consistent with the Census Bureau practices, the FBI had four established racial categories — that is to say, recognized four races: White, Black, American Indian or Alaskan Native, Asian or Pacific Islander.
Starting in 2013, the FBI had five racial categories: White, Black or African American, American Indian or Alaskan Native, Asian, Pacific Islander or Native Hawaiian.
Starting in 2020, the FBI had six racial categories: White, Black or African American, American Indian or Alaskan Native, Asian, Native Hawaiian or Other Pacific Islander, Unknown Race.
Six Races, no Latinos
What about Hispanic Americans, Latinos? According to the USA government from 1995 to the present, Hispanic or Latino Americans are NOT a separate race — they comprise an ethnicity. The vast majority — but it seems not all — of Hispanic or Latino Americans are classified as belonging to the White race. Such has been consistent since 1995. Your author is reporting this — not attempting to unravel the government math or logic involved with distinguishing race from ethnicity.
What else? The addition of “African American” to Black race category in 2013 added no meaningful gains to that population — this was simply updating the label rather than including a significant new sub-group of people.
Two Consistently Applied Categories
For better or worse, the race classifications White and Black have been applied consistently since 1995 in terms both of crime data collection and census data collection. We have the data that we have — the official USA government data, best available.
For the FBI crime data, the races American Indian or Alaskan Native, Asian, Native Hawaiian or Other Pacific Islander, and Unknown Race generally count for less 7% of the total arrests. So we will exclude them from the following visualizations — for that reason, and for the reason that these racial categories are not historically stable. For better or worse, the racial categories White and Black (now, relabeled Black & African American) have been historically stable — the reader can decide what this says about the USA government.
American Crime in Black and White, 1995 to 2019
The graph below shows the population percentages for the Black and White races as defined the USA government for the years 1995 to 2019. Please recall again, that for the purposes of Race not Ethnicity — and particularly for the FBI Crime data — the vast majority of Hispanic and Latino Americans were placed in the White race category. Hence the percentage of the White population will seem much higher than you, dear reader, may typically see reported in the MSM, et cetera. Again, your author is using the government data in accordance and consistent with the government racial categories.
In 1995, according to USA government data, people of the White race comprised roughly 82.8% of the American population; people of the Black race, roughly 12.7%. By 2019, according to USA government data, people of the White race comprised roughly 76.2% of the American population; people of the Black race, roughly 13.5%. Again, we are NOT subtracting people of Hispanic or Latino ethnicity from the people classified as racially White because the FBI Crime data for this time range does NOT do so.
We have the population baseline. Now, we turn to data harvested from the infamous Table 43 of the FBI:UCR, which provides a breakdown of arrests by race. Again, for the visualizations to follow, we are considering the two races which annually account for over 93% of all arrests: White and Black.
The graph below shows the percentage of arrests for all ages and all crimes as broken down by the two primary races in terms of both population size and arrest frequency.
Arrests for All Ages — All Crimes
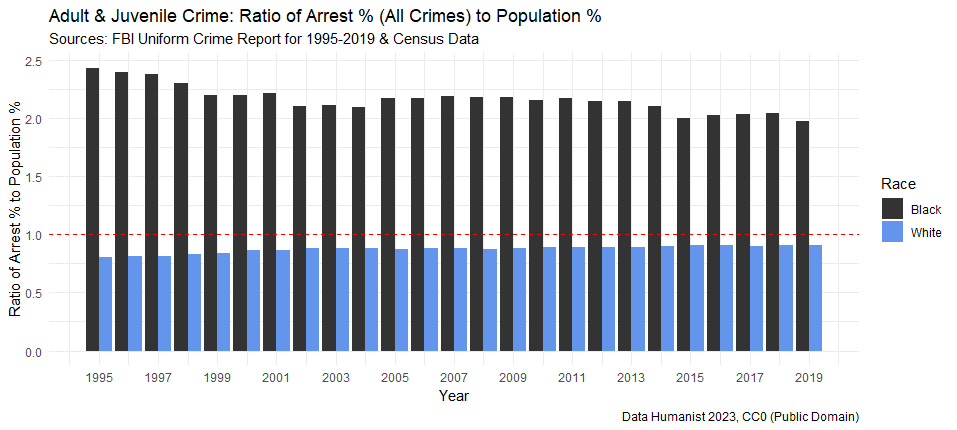
People of the White race as identified by the FBI are arrested more often, and this pattern is clear and consistent from 1995 to 2019. We now scale for population percentage. This is a simple calculation: divide the Arrest % by the Population %. For example, if Group Orange accounts for 60% of the total arrests and 60% of the total population, we get 60/60 or a ratio of 1. The graph below scales for population percentage.
We see a slight decrease in the Black ratio, and slight increase in the White ratio. But the overall pattern is clear, consistent, and beyond dispute. Once we account for population size, people of the Black race as identified by the FBI are arrested at least twice as often as their White counterparts.
But arrested for what? Does the “All Crimes” data really matter?
American Homicide in Black and White, 1995 to 2019
Let’s run the Table 43 data for “Murder and Nonnegligent Manslaughter” — aka, Homicide. The graph below does so for the same time period.
The bad news here is undeniable. For twenty years of the twenty-four years covered, people of the Black race as identified by the FBI were the majority arrestees for homicide —for “Murder and Nonnegligent Manslaughter,” to use the formal FBI Table 43 category. That is, even without accounting for differences in population size, more Black Americans than White Americans were arrested for homicide.
Now, we will scale these grim results for population size — please see the graph below.
How bad? For the twenty-four-year time period under consideration, people of the Black race as identified by the FBI were on average 6.72 times more likely (with a standard deviation of 0.74) to be arrested for homicide (Murder and Nonnegligent Manslaughter) than their White counterparts.
Does the most recent data available show any improvement?
American Crime in Black and White, 2020 & 2021
We come now to the new and quite frankly confusing version of the publicly available FBI Crime data, the FBI Crime Data Explorer — which makes searching by race almost impossible but does push a hate crime narrative and other MSM standards. By law, however, this government data must be available to the public — so download options exist, and your author found what for most part replaces Table 43 on the previous FBI: UCR.
First, let’s set the population baseline. Yet again, your author is NOT subtracting people of Hispanic or Latino ethnicity from the people classified as racially White because the FBI Crime data for 2020-2021 likewise does NOT do so. For 2020, according to established USA government racial categories and subsequent data collection, people identified as belonging to the White race comprised roughly 75.9% of the USA population; people identified as belonging to the Black race, roughly 13.5%. For 2021, roughly 75.8% White; 13.6% Black.
Dear reader, if you wish to protest those numbers — take it up with the Federal government. Likewise, once again, your author is excluding below for the purposes of data visualization the four other races recognized by the FBI: American Indian or Alaskan Native, Asian, Native Hawaiian or Other Pacific Islander, and Unknown Race. Why? Because, once again, people in these racial categories account for less than 7% of the total annual arrests, and because these categories historically have either been instable or applied inconsistently. Got complaints? Send them to the FBI.
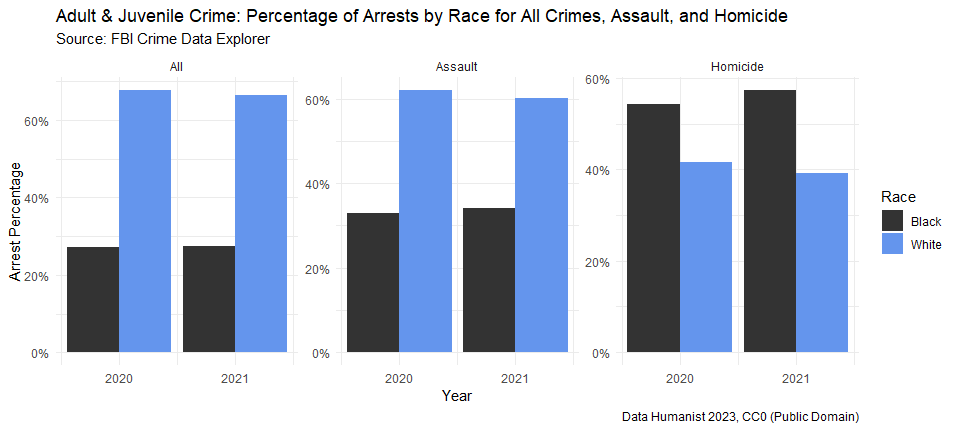
The most recent data available (as Oct 5, 2023) is for years 2020 and 2021 and features an improved and expanded Arrest Offense Category. Besides Total Arrests (All Crimes), we will consider once again Homicide Offenses and Assault Offenses — two distinct types of Criminal Offenses. Please see the graph below.
The results are sadly consistent with the previous twenty-four years of data, excepting perhaps an unhappy increase in the homicide arrest percentage for people of the Black race as identified by the FBI.
When we scale for population size, the results again are sadly consistent. Please see the graph below.
In 2020, people of the Black race as identified by the FBI were 7.32 times more likely to be arrested for homicide than their White counterparts; in 2021, 8.13 more times likely. Under no circumstances should these results be understood as an improvement on the previous twenty-four years.
Preview of Part II
We need to talk about possible causes, contributing factors, and hopeful solutions. We need to stop dismissing any talk of disproportionate black criminality as hate speech — which is the standard MSN and DNC playbook. The FBI data is both horrific and undeniable — as well as the best available.
But we will first need to circle back to the issue we started with — race and juvenile crime in the USA. Part II will briefly review the relevant juvenile crime data for 1995 to 2019, based again on the FBI: UCR. Then your author will return to Professors Loury and McWhorter to summarize some of the insights from their discussion (Sept 11, 2023), and your author will provide his own conclusions.


Highly verboten DH. Well done. How long until the USSA data is altered like the bureau of labor statistics on "jobs" and "inflation"? I see these graphs inverted by 2030, with no relation to reality.